This week and next we have a special report from Tim Price, Director of Investment with PFP Wealth Management.
“In the United States neither paper currency nor deposits have value as commodities. Intrinsically, a dollar bill is just a piece of paper, deposits merely book entries. Coins do have some intrinsic value as metal, but generally far less than their face value. What, then, makes these instruments – cheques, paper money, and coins – acceptable at face value in payment of all debts and for other monetary uses? Mainly, it is the confidence people have that they will be able to exchange such money for other financial assets and for real goods and services whenever they choose to do so.”
– 1961 Federal Reserve Bank of Chicago paper, via Zero Hedge.
“US Economy Grinds To Halt As Nation Realizes Money Just A Symbolic, Mutually Shared Illusion”
– Headline from The Onion.
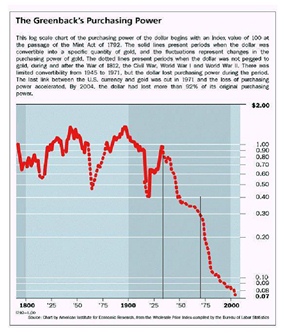
 Graph 1
Historians are taught to discriminate between primary and secondary sources. At the risk of oversimplification, primary sources amount to original history and secondary sources are comment. Financial markets accommodate a similar distinction. Primary sources are objective market prices – a statement of fact (even if those same prices are distorted by central bank action, the price remains the price). Secondary sources are comment – a subjective statement of opinion (for example: editorial from a publication such as The Financial Times will report the price of gold and quickly add that it’s a bubble).
Given the “drinking from a fire hose” nature of our web-enabled world, and the stubbornly finite number of hours in a day, the chances are that most consumers of financial news receive their commentary as secondary sources, filtered via somebody else’s prejudices. Consumers of financial news are also surprised and prone to intellectual denial when they hear the suggestion from market participants that news typically follows the price, rather than the other way around.
Viewing the evolution of market dynamics primarily through primary sources – that is, via the evolution of securities prices – is handy at the best of times. It is particularly helpful in developing an impartial macro view when political deceit is trading at a supernormal premium. As Jean-Claude Juncker, prime minister of Luxembourg and president of the Euro Group, recently conceded to Der Spiegel, there are times when European politicians feel compelled to lie in order to “protect” the electorate. His defence, of course, is couched in Orwellian doublespeak:
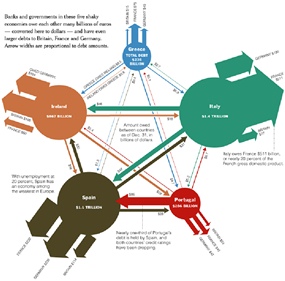
 Graph 2
“In light of the nervousness of the financial markets, it is difficult for us to keep the public adequately and correctly informed all the time. This is regrettable.”
The decline is worse than shown, in that graph 1 doesn’t take into account the history of the recent bail-outs and quantitative easing programmers. But the direction of the currency is clear, and it isn’t up. In the interests of not frightening domestic readers, the path of Sterling isn’t shown, but is comparatively worse. Investment conclusion #1: hedge against ongoing currency degradation with precious metals, starting with gold.
There are other reasons to use graphical representations of markets. Humans are hardwired to recognize patterns and to process images. The earliest forerunners of a written language, on the other hand, started to appear around 6,000 years ago – which in the context of our entire history as homo sapiens, is the blink of an eye. So images carry a lot more weight than text. Take, for example, the network of debt obligations between the nations of Europe, courtesy of the New York Times (see graph 2).
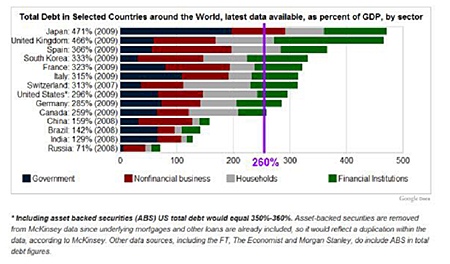
Graph 2 recalls the title of John Lancaster’s puckish study of Britain’s banking and debt crisis: “Whoops ! Why everyone owes everyone and no-one can pay?” Those who like their representations of international sovereign indebtedness in purer form can find an example in graph 3:
 Graph 3
To be continued…
The above data and research was compiled from sources believed to be reliable. However, neither MBMG International Ltd nor its officers can accept any liability for any errors or omissions in the above article nor bear any responsibility for any losses achieved as a result of any actions taken or not taken as a consequence of reading the above article. For more information please contact Graham Macdonald on [email protected]


