As the summer holiday season approaches, the Chinese economy looks in rude health – the IMF measures it as the world’s second largest and predicts it will remain so at least until 2020.1 However, slowing growth and moves by the central bank to increase liquidity reveal a weak underbelly and an addiction to debt.2
Imagine August in Paris. A sunny day, with a pleasant breeze on a walk down the wide pavement of the Champs-Élysées. As you look around you see a long single-file queue outside the flagship store of Louis Vuitton and a mêlée for macaroons at the door of the famous patisserie, La Durée.
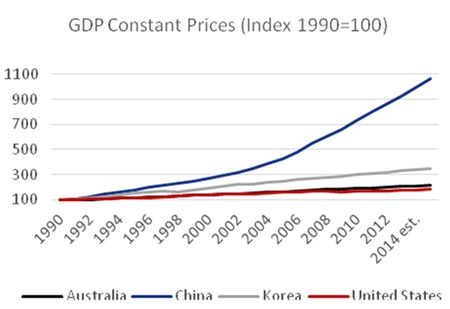 Graph 1 – Source: IMF World Economic Outlook, April 2015.
These people aren’t Parisians, they’re tourists and invariably Chinese: 1.4 million Chinese people visited France in 2012.3 They spend money there too: latest figures reveal that the average Chinese tourist spends €5,400 (c. THB 205,000, USD 6,100) during their stay.4 Nearly half of that goes on shopping, despite the price of coffee near the French capital’s tourist spots.
Coach-loads of tourists are dropped off at the side entrance of Galeries Lafayette, where there are Chinese-speaking staff on hand in a dedicated tax-free section of the famous department store. At Louis Vuitton, Chinese tourists are said to be limited to two purchases each to ensure there’s enough stock for those at the back of the queue – even then many items are sold out in the afternoon.5
So what’s the problem?
Chinese economic growth over the last quarter-century has been huge. At first, this huge economic growth did not go hand-in-hand with debt: between 2000 and 2007 total debt grew only slightly faster than GDP. By 2007 overall debt was at 158% of GDP; by mid-2014, however, this figure had reached 282%.6
This is a concern – there are many examples throughout history where rapid growth has led to financial crisis: the Great Depression7 and the 2008 Global Financial Crisis being just two. As year-on-year economic growth slows and industrial production drops in a similar pattern (see graph 2), that threat becomes more apparent.
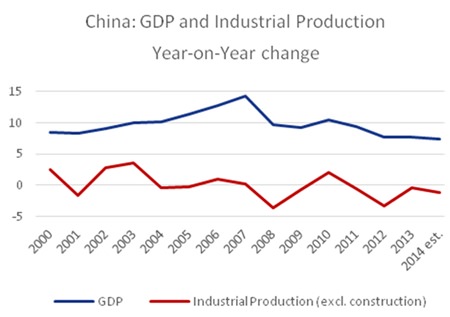 Graph 2 – Sources: IMF World Economic Outlook, April 2015 & St. Louis Federal Reserve.
The reasons for the slowdown are manifold: 1930s America showed an economy cannot grow so quickly forever.8 Growth comprises of changes in labour, capital and productivity which, after years of upturn, these tend to slow – as is happening in China now;9 investment seems to have reached its peak; and the country’s technological advantage with the world’s wealthier countries appears to have narrowed.10
This rapid growth also included increased supply in housing; though not necessarily demand – vacancy rates for homes constructed between 2009 and 2015 were at 15% and expected to be at 20% in 2016-2017.11 This point is emphasized in the phenomenon of Ghost Cities – places such as Kangbashi and Yujiapu, new towns constructed yet barely inhabited.12
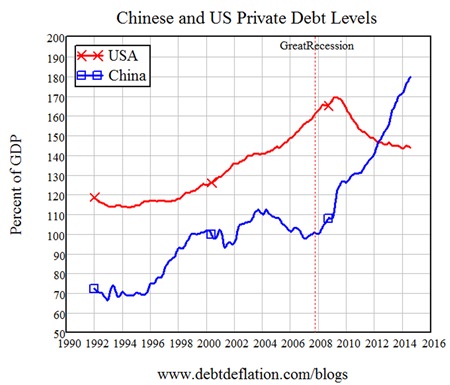 Graph 3
During the global financial crisis, China had huge demand for commodities and industrial inputs. To obtain these, it borrowed its way to meet the demand.13 Private debt is now substantially higher than America’s and, at 125% of GDP, it has one of the highest levels of corporate debt in the world.14 This debt has been positively encouraged by the Chinese government. Each time it has looked like tailing off, the government has pushed it to start again. The latest in a line of examples was in April, when the central bank (PBOC) reduced the reserve-requirement ratio to encourage banks to lend more and reduce their interest rates.15
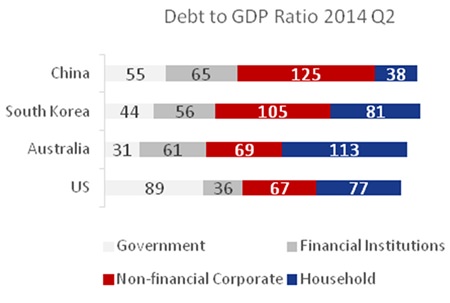 Graph 4 – Source: IMF World Economic Outlook, April 2015.
The PBOC to date has followed the same flawed policies which Western governments implemented in 2008, setting them on the path to a deflation crisis similar to that experienced by Japan over the last 25 years.16 At the current rate of private debt growth, China will reach Japan’s peak level in 2017. It’s worth noting that Japan’s economic slowdown began four years before its private debt peaked.17
If China follows the same pattern as Japan, it would mean a credit crunch within the next two years. If that does start to happen, China’s trade surplus, its huge foreign exchange reserves and the government’s political dominance over banks would enable greater control of the economy than the US government had during the GFC.18
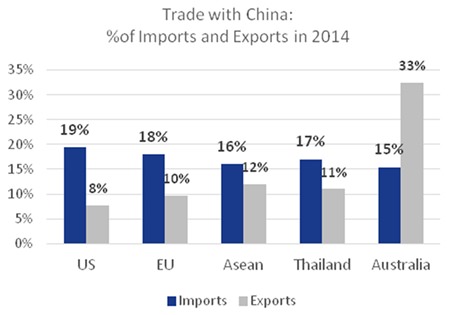 Graph 5 – Sources: US Dept. of Commerce, European Commission DG Trade, ASEAN, Bank of Thailand, Australian Department of Foreign Affairs and Trade.
That said, if the Chinese government’s reaction once again is to maintain the line of private-debt-financed growth, then it could well lead to another Japanese-style debt deflation. This would mean that there would be less money in corporate and individual pockets and thus less demand.
Much is at stake: such a scenario would have negative implications for the global economy. China is not only the largest importer to the US and the EU; it also represents the second largest export market for both.19 The country dominates Australia’s trade – especially its export market, due to its sale of iron ore, coal and gold.20 Locally, it is both largest exporter and importer with the combined ASEAN countries.21 It also by far the largest trade partner with Thailand.22
All we can do is prepare ourselves for the worst-case scenario, so we can react quickly.
Footnotes:
1 IMF World Economic Outlook, April 2015
2 China’s RRR Cut: What does it achieve?, MBMG IA Update, April 2015
3 http://www.lefigaro.fr/mon-figaro/2014/05/30/10001-20140 530ARTFIG00294-
les-touristes-chinois-de-plus-en-plus-nombreux-et-fortunes.php
4 http://www.lefigaro.fr/conso/2015/01/29/05007-20150129 ARTFIG00132-
les-touristes-chinois-depensent-plus-en-france-qu-a-singapour-ou-aux-etats-unis.php
5 http://french.china.org.cn/travel/txt/2012-09/06/content_ 26448064.htm
6 Debt and (not much) Deleveraging, McKinsey Global Institute, February 2015
7 See Investment Markets: is there anything to learn from 1929?
Parts 1 & 2, MBMG IA Update May 2015
8 ibid
9 http://www.economist.com/blogs/economist-explains
/2015/03/economist-explains-8
10 ibid
11 http://blogs.wsj.com/chinarealtime/2014/05/16/
chinas-ghost-cities-are-about-to-get-spookier/
12 http://www.businessinsider.com/chinas-ghost-cities-in-2014-2014-6
13 Steve Keen, Outlook 2015, IDEA Economics http://www.ideaeconomics.org/
14 Debt and (not much) Deleveraging, McKinsey Global Institute, February 2015
15 http://www.frbsf.org/education/publications/doctor-econ
/2001/august/reserve-requirements-ratio
16 Steve Keen, Outlook 2015, IDEA Economics http://www.ideaeconomics.org/
17 ibid
18 ibid
19 Statistics from US Department of Commerce and European Commission DG Trade (2014)
20 Australian Government: Department of Foreign Affairs and Trade
21 ASEAN (2014)
22 Bank of Thailand (2014)
| Please Note: While every effort has been made to ensure that the information contained herein is correct, MBMG Group cannot be held responsible for any errors that may occur. The views of the contributors may not necessarily reflect the house view of MBMG Group. Views and opinions expressed herein may change with market conditions and should not be used in isolation. MBMG Group is an advisory firm that assists expatriates and locals within the South East Asia Region with services ranging from Investment Advisory, Personal Advisory, Tax Advisory, Corporate Advisory, Insurance Services, Accounting & Auditing Services, Legal Services, Estate Planning and Property Solutions. For more information: Tel: +66 2665 2536; e-mail: info@mbmg-group.com; Linkedin: MBMG Group; Twitter: @MBMGIntl; Facebook:/MBMGGroup |


