The performance of government bonds is obviously related to the movement in interest rates. However, the movement in interest rates can be very long term in duration and distort asset allocation models indefinitely. Over the past 65 years since the last time we were at 2% US government bond rates in 1948, or 6 o’clock on our inflation/deflation clock, interest rates have had a general rise then a decline. Therefore, forward looking ten year future return forecasts vs long term averages can be very inappropriate.
My thanks to my business partner, Paul Gambles, for this research piece by Craig L Israelsen on the topic:

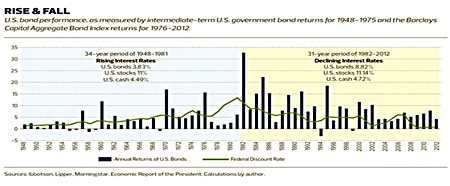
“From 1948 through 1981, the federal discount rate increased – not every year but as a general trend. In 1948, the federal discount rate was 1.34%, and by 1981 it reached 13.42%. During this time of rising interest rates, the average annualized return for U.S. bonds was 3.83%. In the Rise & Fall chart on this page, the year-to-year performance of U.S. bonds is represented by the vertical bars. The U.S. bond performance was measured using intermediate-term U.S. government bond returns from 1948 to 1975 and the Barclays Capital Aggregate Bond Index returns from 1976 to 2012.
Notably, U.S. stocks (as measured by the S&P 500) showed essentially the same performance during both periods. From 1948 to 1981, when interest rates were rising, the S&P 500 had an annualized return of 11%. During the recent 31-year period of declining interest rates, the S&P 500 generated an 11.14% annualized return. So, while interest rate movement has a marked impact on bond returns, stocks have been largely immune – they tend to march to a variety of drummers.
Furthermore, cash (as represented by the three-month Treasury bill) also seemed relatively unaffected. Cash averaged 4.49% during the 34-year period of rising interest rates and 4.72% during the 31-year period of declining rates.”
Firstly, it is interesting that this research fits in exactly with our Kondratieff inflation / deflation analysis. Secondly, that if you optimize the first thirty year cycle into a multi asset portfolio you would get a very different answer to that of the second 30 year period. 3.8% vs 8.8% is a very large variance and as catastrophic as getting the shorter but equally difficult equity 15 year periods right and wrong.
This analysis of US bond markets since 1948 leads us to conclude that US Government Bonds should not form part of any global portfolio in an unconstrained world. Advisors may ask: should we avoid bonds as an ingredient in a diversified portfolio for the next week, next 30 years or forever?
Once again thanks to Paul for providing further research piece by Craig L Israelsen on the topic.
During the 34-year period of rising interest rates between 1948 and 1981, an all-bond portfolio returned an average 3.83% per year, whereas during the last 31 years it produced an average annualized return of 8.82%. The difference in return for an all-bond portfolio during these two distinct time frames was a staggering 499 basis points per annum.
How about a two-asset portfolio? Let’s assume the classic “balanced” design, with 60% allocated to stocks (as measured by the S&P 500) and 40% to bonds, in a portfolio that is rebalanced annually. The differential in performance in a two-asset portfolio across the two time periods is much less dramatic, even though the positive impact of bonds is clear in the more recent 31-year period. A performance difference of 499 basis points in an all-bond portfolio shrinks to a 204 basis points difference in a 60% stock / 40% bond, two-asset portfolio (10.56% versus 8.52%).
A four-asset portfolio that allocated 40% to large U.S. stocks, 20% to small U.S. stocks, 30% to bonds and 10% to cash (with annual rebalancing) generated an annualized return of 9.52% during the 34-year period when interest rates were rising and a 9.99% annualized return during the last 31 years, when rates were falling. The performance differential across the two time frames now shrinks to a mere 47 basis points.
Clearly, as diversification increases within a portfolio, the impact of the performance of one asset class on the overall portfolio is significantly reduced (assuming the allocations are not skewed heavily toward only one asset). This is precisely why portfolios should be diversified – by doing so, we lower risk by preventing the bad performance of one particular asset class from sinking a portfolio’s overall returns.
For a person who places all of their investments in one asset – whether bonds or stocks or real estate – timing is everything. As it pertains to bond performance, the difference between the worst case 10-year period and best-case 10-year period for a 100% U.S. bond portfolio was nearly 1,300 basis points.
As we have stated on previous occasions, “Diversification is ‘The one free lunch’. Market timing between asset classes, even cash and bonds, can have significant effects.”
| The above data and research was compiled from sources believed to be reliable. However, neither MBMG International Ltd nor its officers can accept any liability for any errors or omissions in the above article nor bear any responsibility for any losses achieved as a result of any actions taken or not taken as a consequence of reading the above article. For more information please contact Graham Macdonald on [email protected] |


